How to request Plant Count and Size Analysis
The Agremo WebApp now includes a comprehensive Plant Count, Size, and Health analysis feature. This guide provides step-by-step instructions for accessing these features and utilizing them to gain valuable insights into your fields.
Requesting Plant Count and Size Analysis
- Open Map: Select the project or field from your dashboard to open its map.
- Select Annotation: Click on the annotation you want to analyze. For multiple annotations, use the multiple selection tool. Selected annotations will turn yellow.
- Choose Analysis: Click on the “Choose Analysis” field. A drop-down list of available analyses will appear.
- Select Analysis: Choose “Plant Count and Size Analysis” from the list.
- Request Analysis: A new modal will appear for requesting the analysis.
- Enter all necessary data in the modal. All fields are mandatory.

- Seeding Density:
- Area Based: Enter the number of plants per hectare.
- Distance Based: Enter the distance between plants and the distance between rows.
- Run Analysis: Click the “Run Analysis” button.
- Success Message: A message will appear: “Success! Your Agremo Analysis is successfully submitted!”

Viewing Analysis Results
- Notification: When the analysis is complete, you will receive a notification via email and within the app.
- Open Map: Select the project or field from your dashboard to open its map.
- Stats Button: Click on the “Stats” button.
- Choose Analysis Result: Select the analysis result you wish to view. The map with results and the stats side-bar will appear.

Display of Results on the Stats Bar
Plant Count and Size Data: The analysis includes:
- Number of plants in the field
- Size of each plant counted
- Health of each plant counted
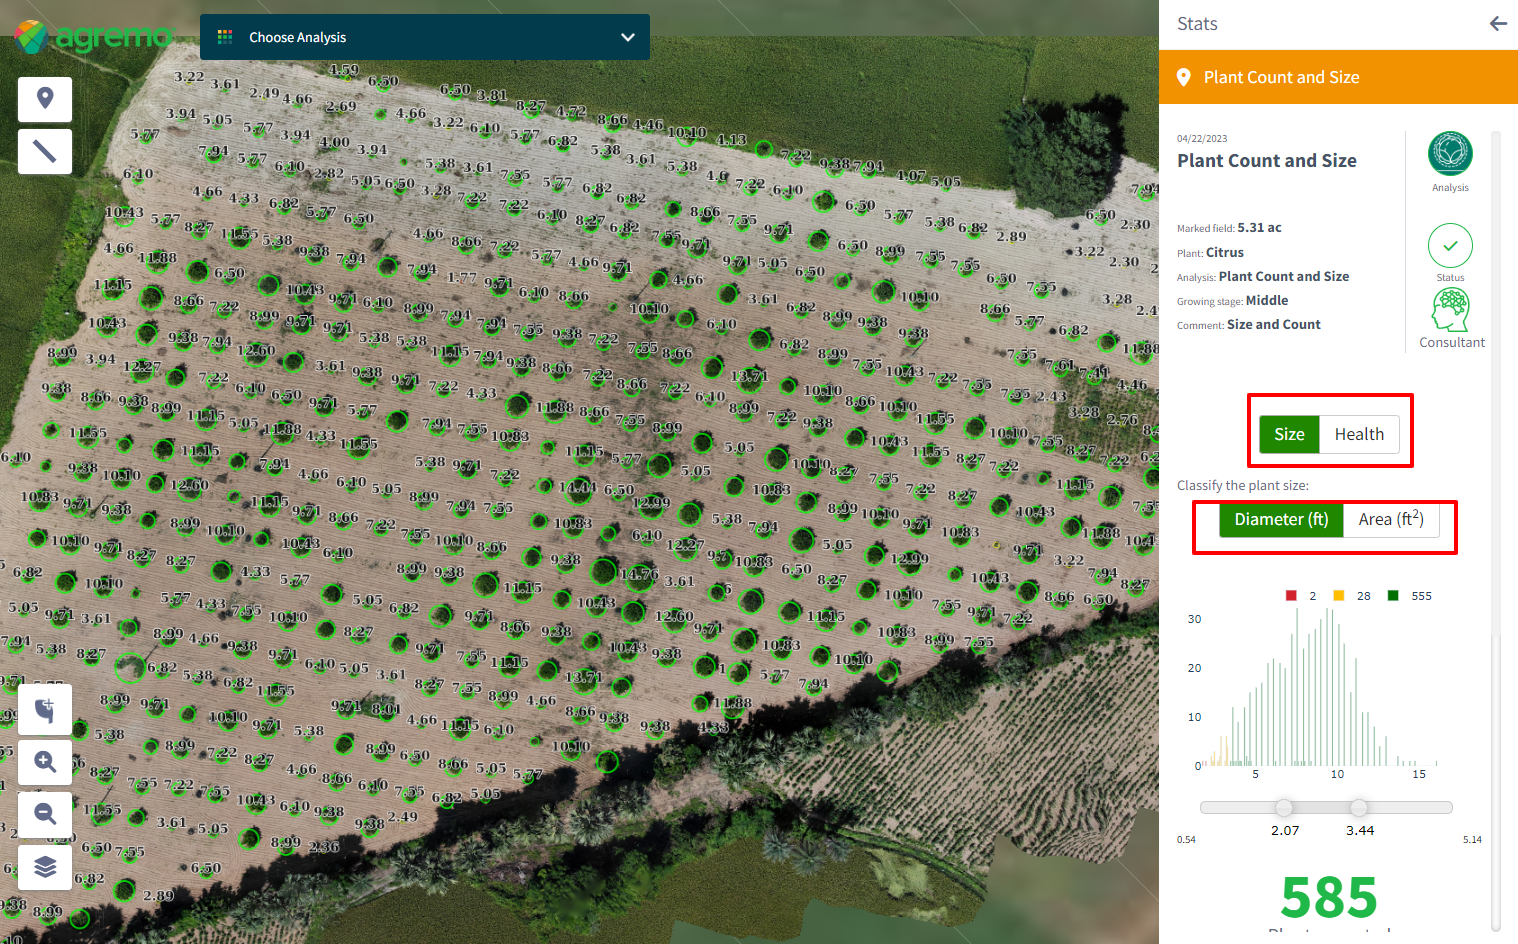
Plant Size
- Default Tab: The “Size” tab is included by default.
- Size Classification: Plants can be classified by diameter (default) or area.
- Histogram: The histogram shows three clusters (green, yellow, red):
- Red: Smallest plants
- Yellow: Medium-sized plants
- Green: Largest plants
- Interactive Clusters: Click on clusters to toggle visibility on the map and histogram.
- Editable Slider: Adjust the slider to define cluster values. Changes are saved per user session.
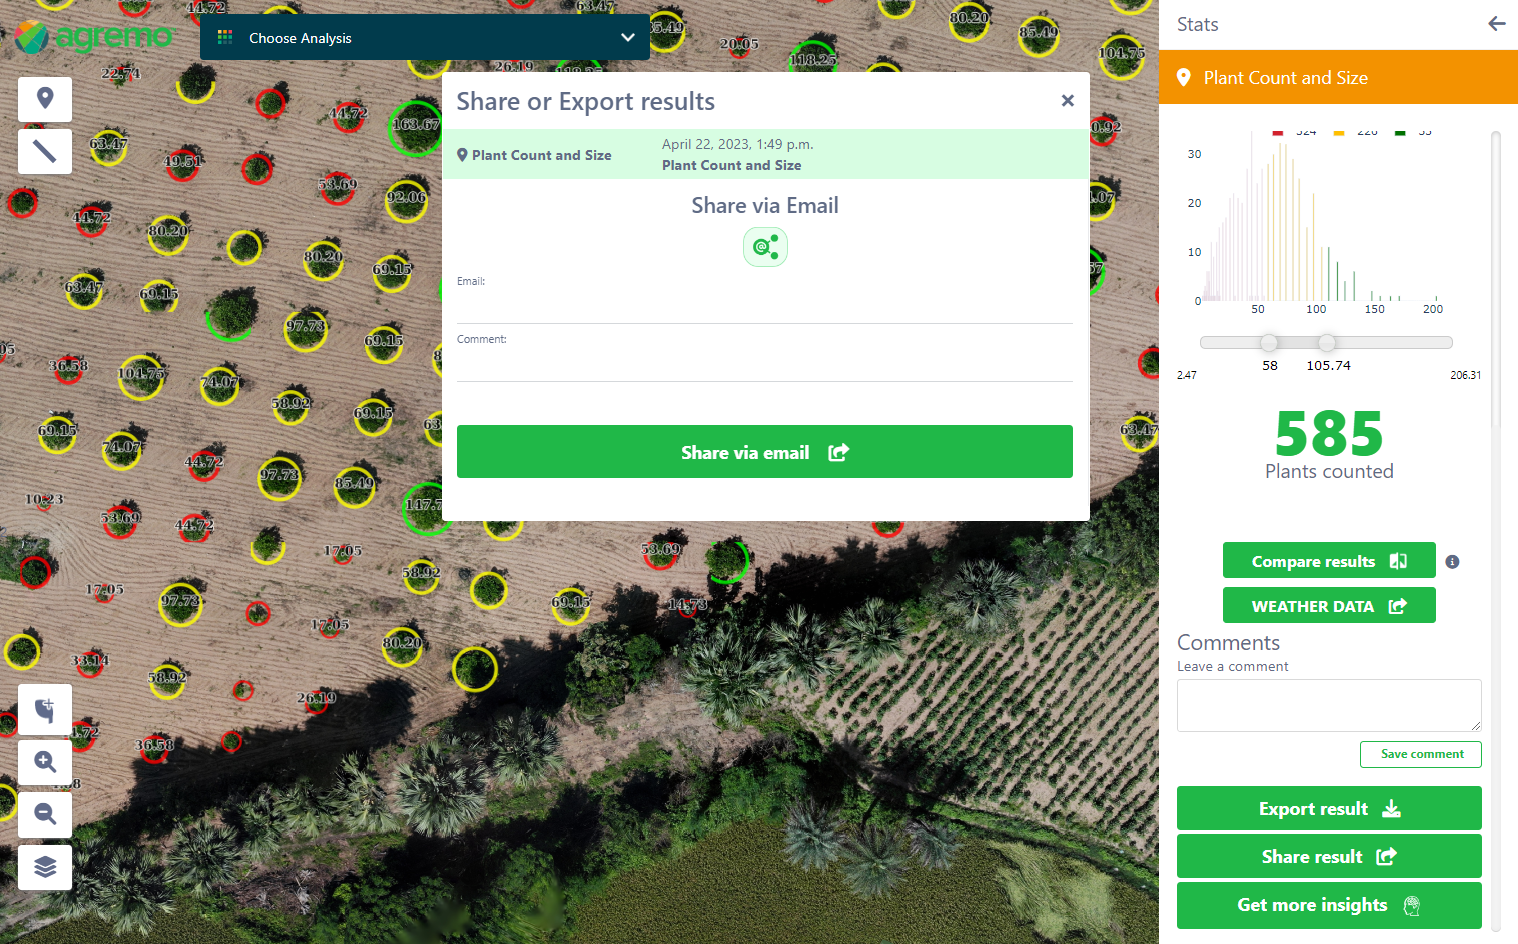
- Plant Count: The total number of counted plants is displayed below the histogram.
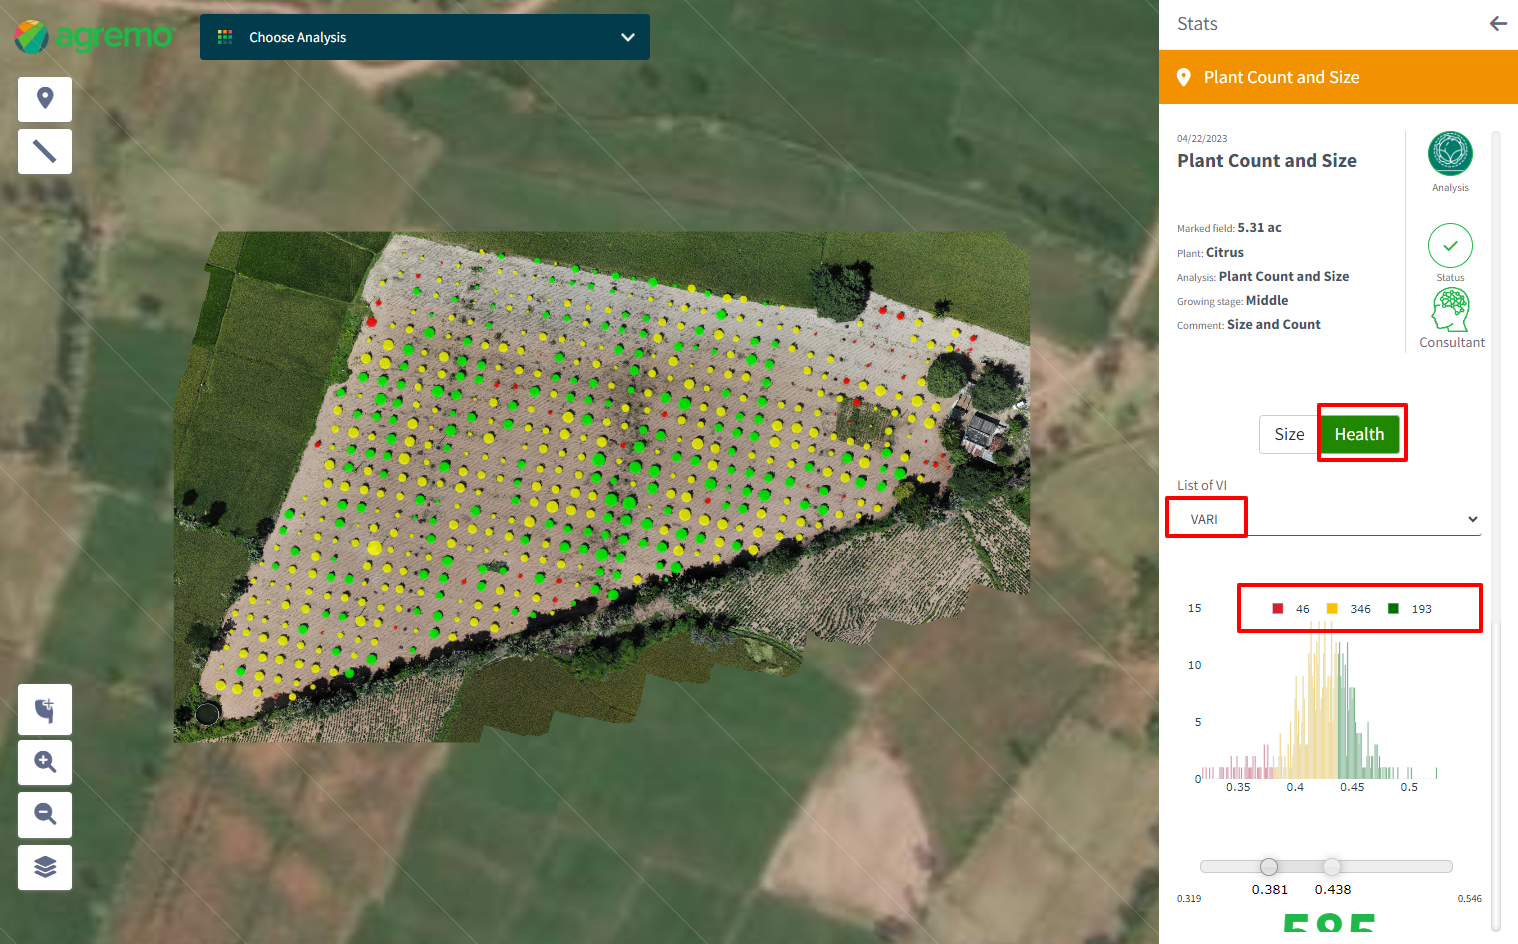
Plant Health
- Health Tab: Click on the “Health” tab to view the plant health analysis.
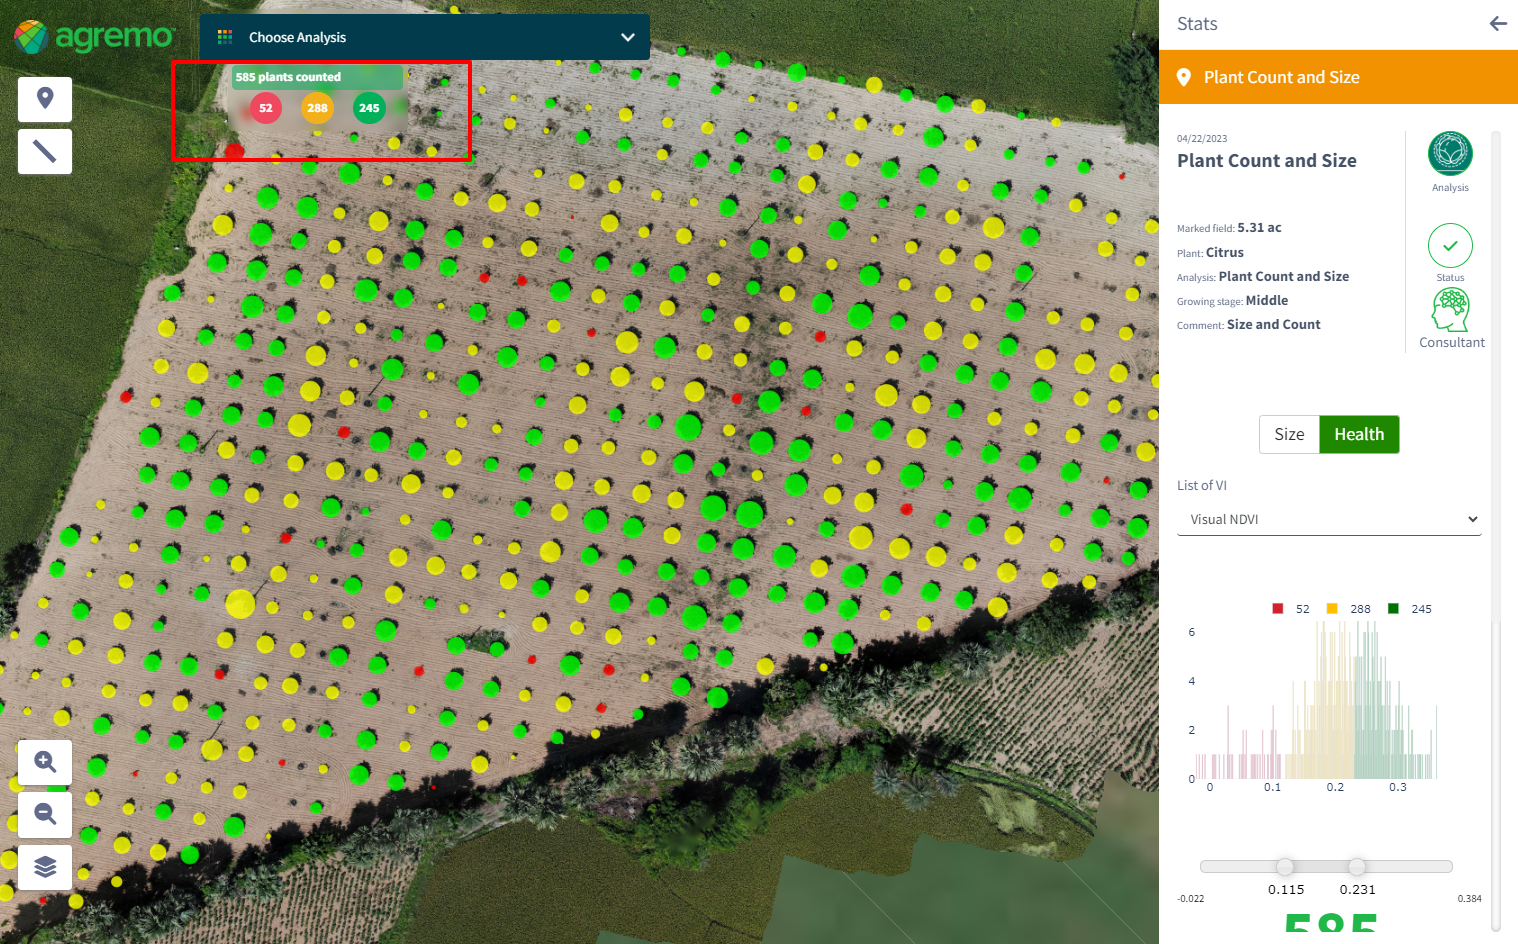
- Vegetation Indexes: Select from EXG (default), VARI, GLI INDEX, and Visual NDVI.
- Histogram: Similar to plant size, the histogram shows three clusters (green, yellow, red) representing different health levels.
- Interactive Clusters: Click on clusters to toggle visibility on the map and histogram.
- Editable Slider: Adjust the slider to define health thresholds. Changes are saved per user session.
- Plant Count: The total number of counted plants is displayed below the histogram.
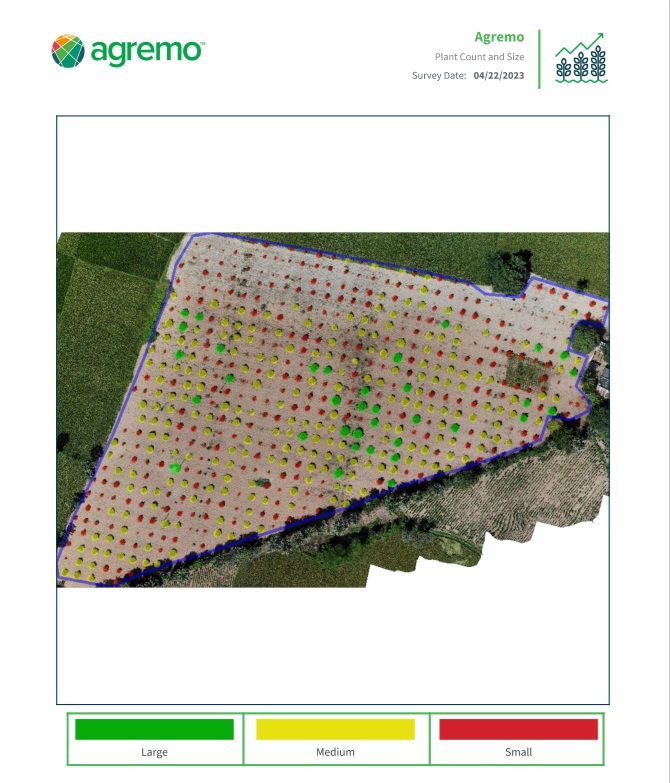
Display of Results on the Map
- Plant Representation: Each plant is represented as a circle on the map. The color corresponds to its cluster.
- Histogram Changes: Any adjustments to the histogram slider will reflect immediately on the map.
- Size Analysis: Plants are shown with transparent circles indicating their size. Small plants have specific size display rules.
- Health Analysis: Plants are color-coded without visible VI values or borders.
Using the Compare Tool
- Requirements: You must have at least two analyses for comparison.
- Compare Tool: Click the “Compare” button to open the comparison panel.
- Comparison Options: Choose between comparing Size and Health analyses.
- Legend: A legend is displayed for both maps at the top of the screen, showing analysis details.
Exporting and Sharing Results
- Export Results: Click “Export Results” to generate a PDF report.
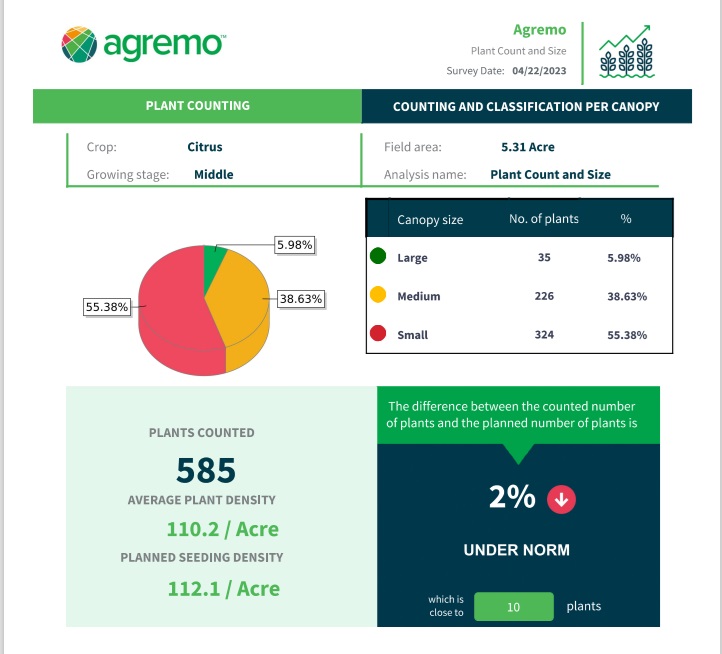
- PDF Reports: Two types of PDFs are available:
- Plant Size: Includes input information, pie chart, and table with plant size classifications.
- Plant Health: Includes plant health details, pie chart, and table with health classifications.
- Report Contents: Reports contain all the details set up by the user before requesting the report.
Analysis History and CSV Export
- Analysis History: Access the analysis history to view past analyses.
- CSV Export: Export the analysis history as a CSV file, including detailed information such as user email, field name, location, crop type, analysis date, and more.