Agremo’s State of the Farm product allows insurance assessors to recreate innovative and affordable insurance options. Our cutting-edge analytics software delivers accurate data which helps improve your company’s insurance products by enabling easier, quicker, and more affordable crop counting, monitoring, malfunction, and disease detection. This helps you to identify and quantify crop damage, as well as estimate the overall state of crops and determine potential risks. With State of the Farm, insurance assessors make more accurate risk and premium assessments. In that way, they reduce the chances of unaligned payouts and prevent conflicts between the insurance company and policyholders.
Free demo - no credit card required
Agremo follows all security protocols set by the industry, including GDPR. In addition to that, we also incorporated internal protocols, so your data is protected both from inside and outside.
Yes, we can. Agremo can process any aerial image regardless of whether it is coming from a drone, airplane, or a satellite. Depending on the area you wish to cover and analyze, as well as the type of analyses, some of the sources might be more appropriate than others. Agremo can provide you with data through our drone, airplane, and satellite mapping partners.
If you don’t have internal resources for drone mapping, we can do that for you by utilizing our drone resources or finding a fit 3rd party drone service provider in our DSP partner network. In addition to that, if you are interested in building up your drone team, we can guide you through that process as well. We can also utilize our airplane and satellite mapping partners for larger areas.
The best-case scenario is to have the map before the damage has occurred as well as immediately after the accident. By comparing the data we can achieve high accuracy as well as short turnaround time for deliverables. We strongly recommend exploring the hybrid model built on drone and satellite or airplane data.
Yes, you can. Our Enterprise level clients sometimes might require API integration with their existing in-house solutions, or some 3rd party software. Agremo development team consists of experienced software engineers that can make such requests happen in time for you to start your project.
The standard processing time for standard cases from the moment of the request is up to 2 business days. Usually, the reports are delivered within 24h. As insurance requests can range by pre-policy check all the way to hurricane damage assessment, the turnaround time can be faster or slower depending on the case.
Agremo can guide you on every step of the journey. We can work with you on project design and planning, implementation, drone mapping, analyzing the data, and result deliverable, and further processing and application. We can easily set up a POC (proof of concept) project in the year zero or even on a single damage assessment request, so you can get familiar with the technology, workflows, and pass through any trial-and-error steps at your own pace.
Depending on the crop we can do it after a couple of weeks after the sowing/planting/replanting has happened. Let us know what are the crops of interest and what is your business case challenge, and we will gladly provide you with more information.
Agremo can identify and quantify most of damage done depending on the crop and the peril. Every technology has its limitations, so unfortunately with tree fruits such as apple, oranges, pears, it is hard to assess hail damage, as lots of fruits are hidden inside the tree canopy. On the other hand, green snap in corn is one of the more popular requests in the US Midwest, while in LATAM we have done lots of plantation damage assessment after Hurricanes Maria, Lorena, and Narda. Let us know what are the crops of interest and what is your business case challenge, and we will gladly provide you with more information.

Agremo's AI solution turns DJI's drone imagery into actionable insights, and its recipe maps make our AGRAS drone a truly intelligent and precise spraying tool." The integration of the Agremo platform between Agremo and the DJI drone is a turnkey solution for precision agriculture.
The biggest benefit for farmers who use drones and Agremo reports is that they increase their yields, reduce costs or improve their productivity. In the end, all these benefits are lead to extra profits.
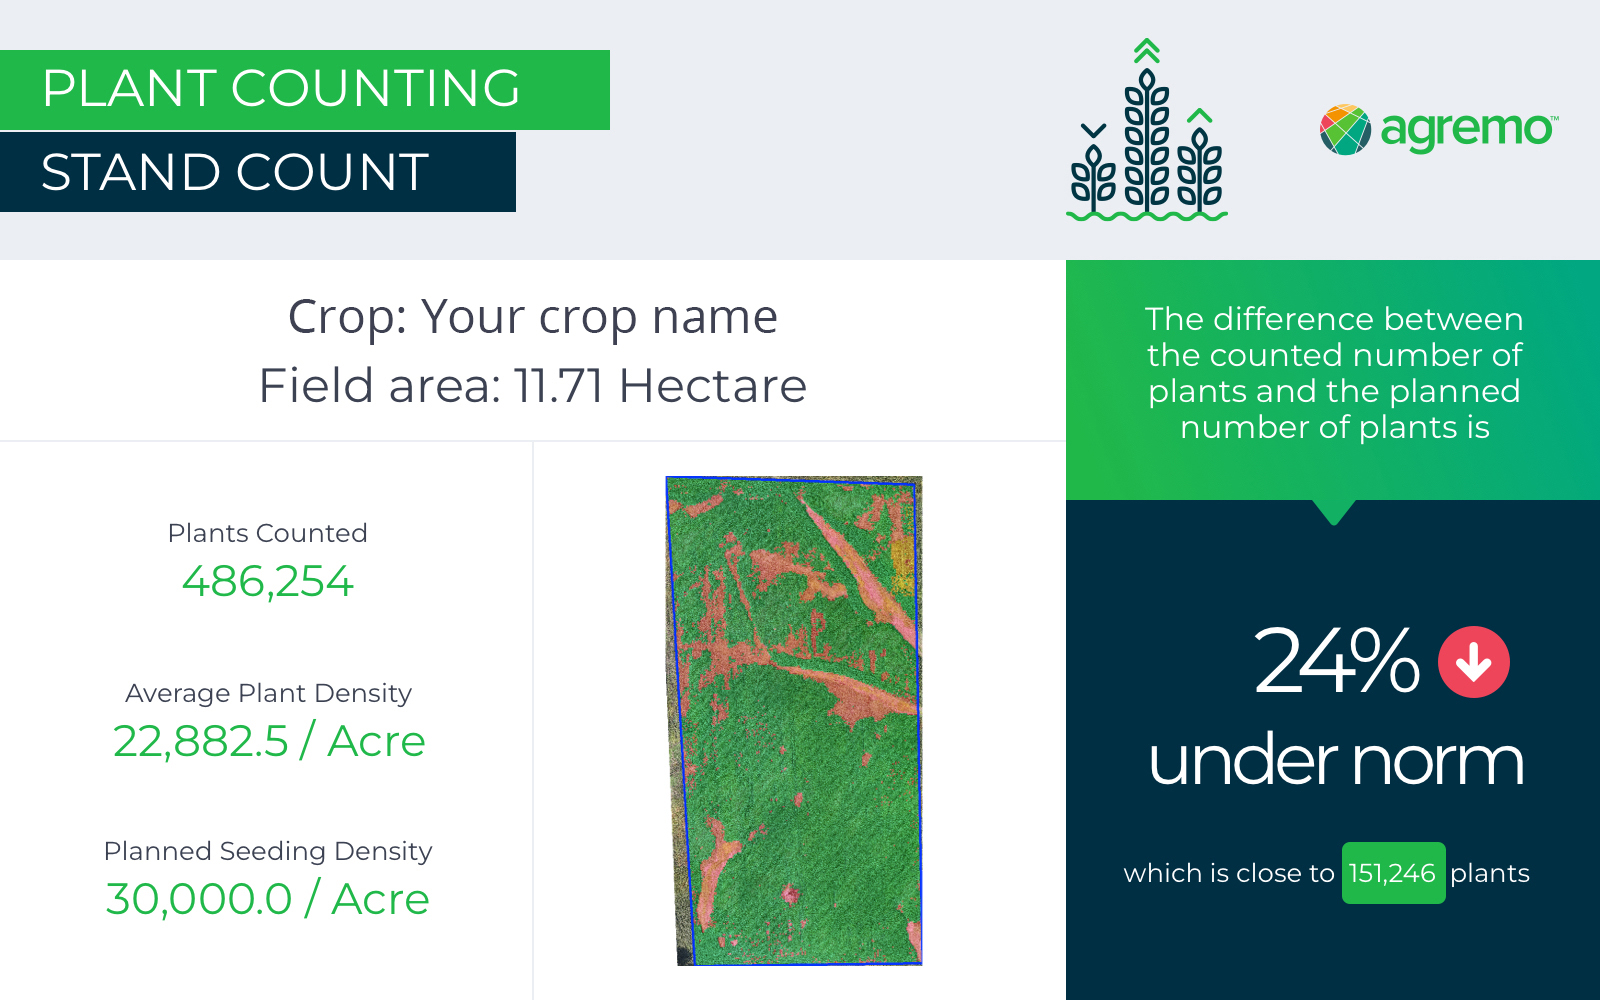
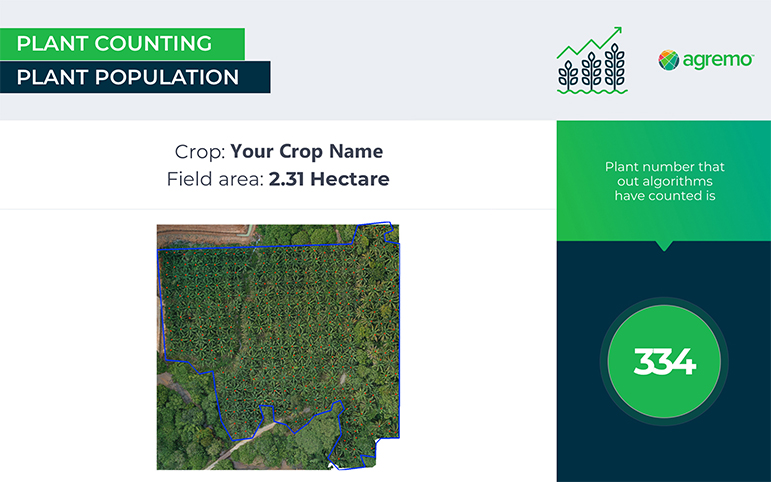
Agremo Stand Count analysis shows how successful seeding was and how many plants farmers will be able to harvest. Withal, it can help to apply different sowing standards in different parts of the plot, in order to achieve the highest yields.