
Overview
With Satellite Monitoring, you can continuously track crop performance and field conditions using satellite imagery and advanced vegetation analysis by monitoring:
- Crop health and variability
- Vegetation indices (NDVI, NDRE, NDWI, RECI, EVI, MSAVI, etc.)
- Early alerts for potential crop stress and field issues
- Field performance changes over time through historical comparisons
- Prescription maps for targeted field management decisions
The generated insights help you detect problems early, make data-driven decisions, and optimize field management throughout the growing season.
Satellite Monitoring uses integrated Sentinel-2 satellite imagery with a 10 × 10 m resolution to provide continuous field insights.
Agremo automatically updates satellite images every week, allowing users to analyze current field conditions and access historical data to track crop development and changes over time. Agremo does not generate maps with cloud coverage above 30% of the field area.
How to Access
From the Field List
- When creating a new field, satellite imagery is automatically generated based on the defined field boundary.
- From the Field List, open an existing field with available satellite imagery.
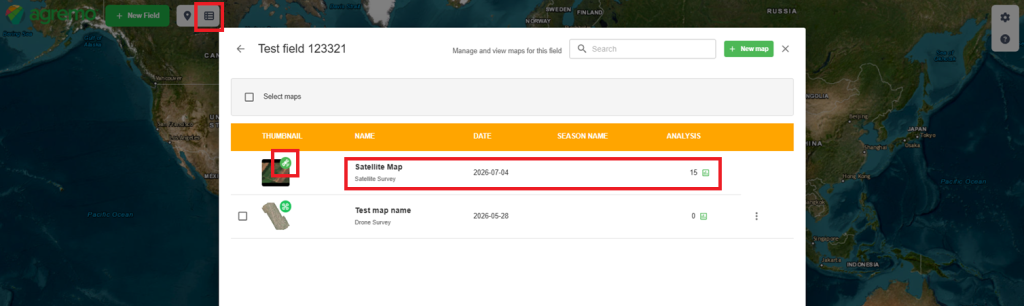
- Additionally, fields with satellite data display a Satellite icon in the analysis column, where users can view the number of generated satellite images and the date of the latest image.
- Open the satellite imagery section to access available satellite-based analyses and monitor field conditions over time.
From the Notifications Tab
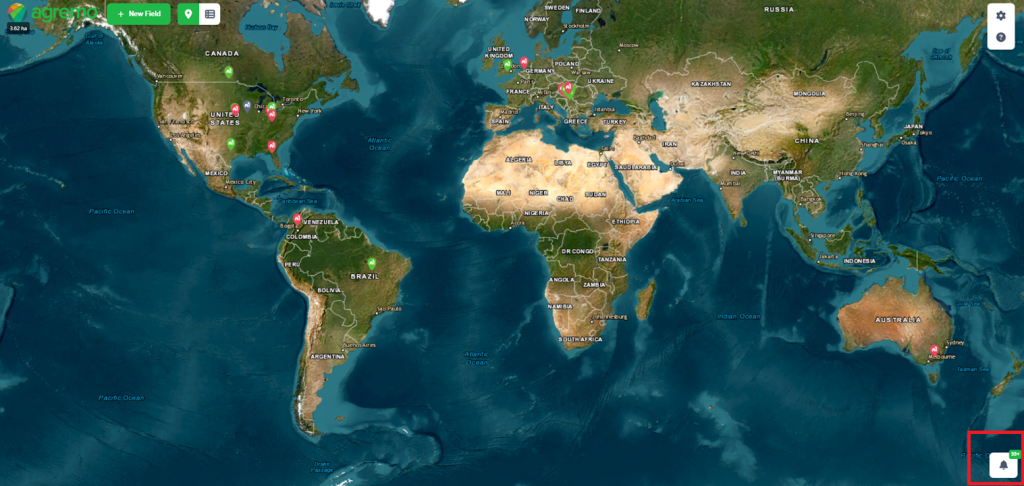
- Each time a new satellite image is generated, a notification is created in the Notifications tab.
- Users are also informed via email when new satellite imagery becomes available.
- Open the notification to access the latest satellite imagery and available field analyses directly.
How It Works
Creating a New Field
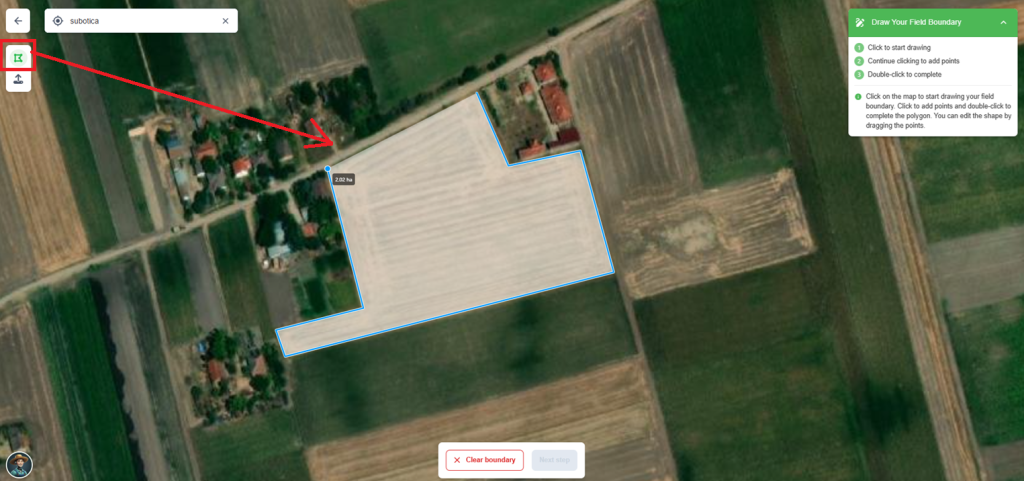
- Click New Field to create a new field.
- During field creation, define the field boundary as accurately as possible, since satellite imagery is generated from the defined field area.
- The field boundary can be created manually by drawing it on the map or imported as an SHP file.
- Once the field is created, Agremo automatically starts generating available satellite imagery for the defined area.
2. Monitor Field Performance with Satellite Imagery
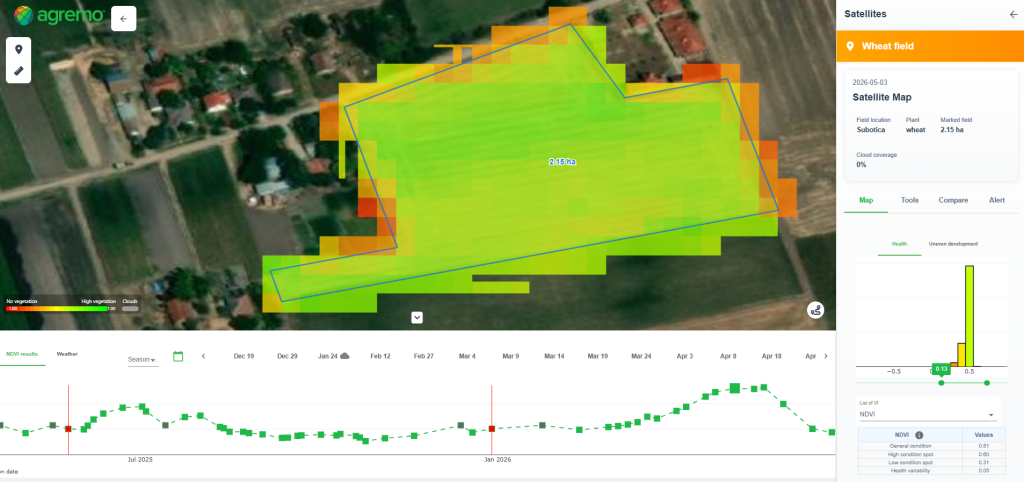
- Open a field with available satellite imagery and navigate to the MAP VIEW tab.
- The right sidebar displays:
- General field information
- A vegetation index histogram with an adjustable slider for more precise analysis
- A vegetation index selector
- Statistical data based on the selected vegetation index
- By default, the map and statistics are displayed using the NDVI vegetation index.
- Use the vegetation index dropdown to switch between: NDVI, NDRE, NDWI, RECI, EVI, MSAVI
- The statistics table automatically updates based on the selected vegetation index.
Uneven Development Detection
- When significant differences in crop development are detected across the field, an additional Uneven Development tab becomes available next to the Results tab.
- This tab highlights areas where crop growth is not uniform and provides:
- The exact location of affected areas
- The total surface area of unevenly developed zones
- A visual representation of variability across the field
- Use this information to identify parts of the field that may require further inspection or management actions.
Note: During very early growth stages, when crop emergence is not yet expected or is only beginning, detected uneven development may indicate the presence of weeds rather than actual crop variability. In such cases, the Uneven Development layer can serve as an early indicator of potential weed infestations and should be verified through field scouting.
Historical Field Monitoring
- At the bottom of the screen, a line chart provides a historical overview of your field based on satellite imagery collected over time.
- Each point on the chart represents a date when a satellite image was acquired.
- Click on any point, calendar entry, or date label to display the corresponding satellite image on the map and update the histogram and statistical data in the sidebar.
- The line chart always displays NDVI values to provide a consistent view of field development over time, regardless of the vegetation index currently selected in the map view.
Cloud Coverage
- Satellite images with cloud coverage exceeding 30% of the field area are not processed or displayed.
- These dates are marked with a cloud icon on the timeline, indicating that imagery was unavailable due to excessive cloud cover.
Note: Historical satellite imagery allows you to compare field conditions over time, identify trends, and detect potential crop issues before they become visible in the field.
3. Detect Field Issues Early with Satellite Alerts
- Alerts can be accessed from the ALERTS tab whenever an alert is available for the selected field.
- Alerts are also highlighted as red markers on the satellite monitoring timeline at the bottom of the MAP VIEW page.
- Users also receive an email notification whenever a new alert is generated.
- For each generated alert, users can download a PDF report containing the alert details and relevant satellite analysis results.
Alert Types
Vegetation Emergence Alert
- This alert typically appears at the beginning of the growing season when vegetation emergence is detected.
- It helps confirm that crop development has started within the monitored field.
- In some cases, if this alert appears during a period when crop emergence is not expected, it may indicate the presence of significant weed growth rather than crop emergence.
- For this reason, the alert can serve as an early indicator of potential weed infestations and should be verified through field inspection.
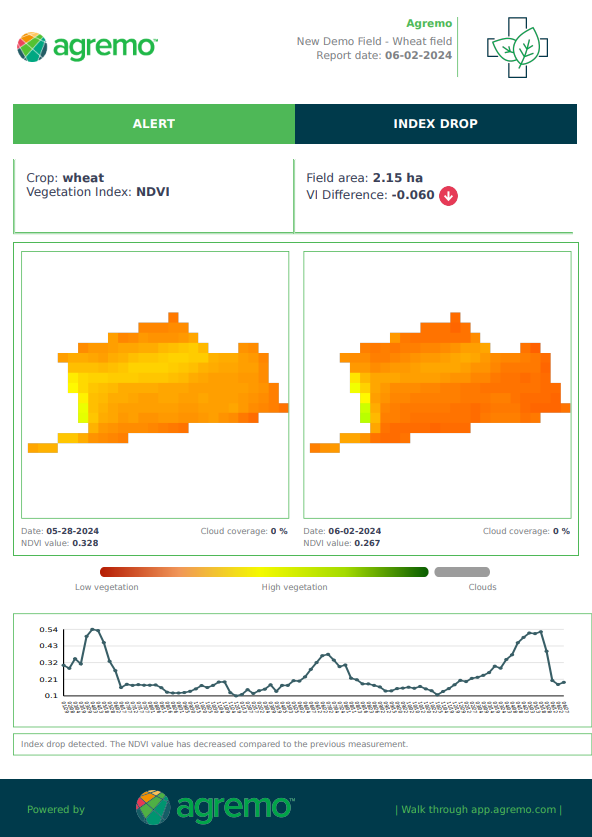
Vegetation Index Drop Alert
- This alert is triggered when a vegetation index value drops significantly more than expected between two satellite observations.
- Such changes may indicate crop stress, disease pressure, pest damage, water-related issues, or other factors affecting crop health.
- When this alert is opened, Agremo automatically directs the user to the Compare Tool, where the alerted image can be compared with imagery from the previous week.
- The comparison view helps identify affected areas and quantify changes over time.
4. Create Management Zones and Prescription Maps with AG Tools
- Click AG Tools in the Stats panel to access tools for creating management zones and prescription maps.
- Available tools include:
- Zonation Management for creating field management zones based on vegetation variability.
- Spraying Tool for creating prescription maps for variable-rate spraying applications.
- Fertilizer Tool for creating prescription maps for variable-rate fertilizer applications.
5. Compare Field Changes Over Time
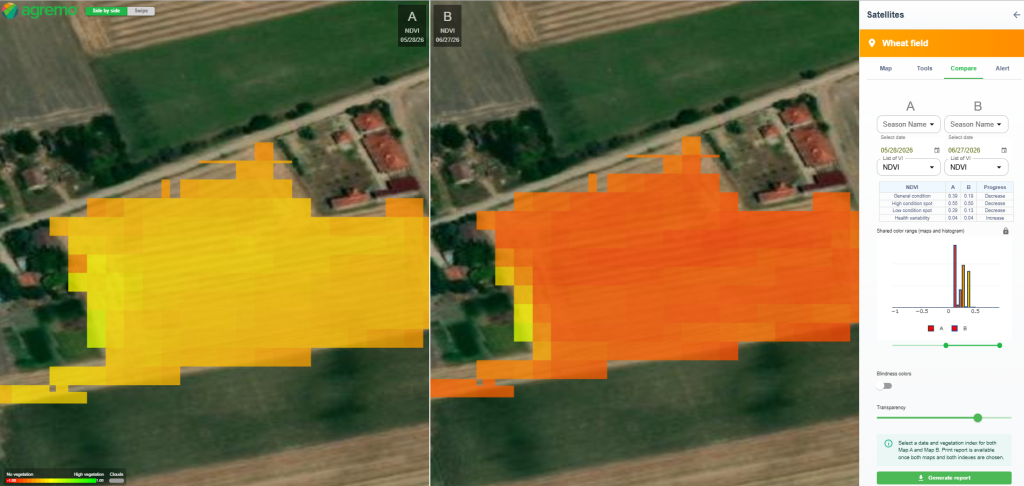
- Open the Compare Maps tool to analyze changes in field conditions between two satellite images.
- Select the maps you want to compare by choosing the desired season, date, and vegetation index (VI) for each map.
- You can display the selected maps side by side or use swipe mode to visually compare field conditions and identify changes between two satellite observations.
- A comparison table provides detailed statistics for both maps, including the difference in values and the overall change between observations.
- When users select the same vegetation index for both maps, the comparison table highlights the progression and changes in index values over time.
Histogram and Value Range Settings
- By default, Agremo synchronizes the histograms and color scales for both maps, ensuring that both maps use the same value range for visualization.
- This makes it easier to perform an accurate visual comparison between the two satellite images.
- Click the lock icon to unlock the scales and adjust the histogram ranges independently for each map.
- This option can be useful when analyzing subtle variations or focusing on specific value ranges within each image.
Exporting Comparison Reports
- Once you have configured the comparison, you can generate and download a PDF report.
- Agremo generates the report based on the latest comparison settings and includes the selected maps, vegetation indices, and calculated differences.
6. Receive Notifications for New Satellite Results
- As a result, each time Agremo generates a new satellite image, users receive a notification both by email and in the Notifications tab within the application.
- By opening the notification, users can directly access the latest satellite image and review the updated field results.
- Users can download the Weekly Report, which provides information about the latest satellite image and compares it with the previous observation, helping them track field development and changes over time.
- The report allows users to analyze crop progress by comparing field conditions between two different dates.
Managing Satellite Notifications
- Users can enable or disable satellite result notifications at any time from Settings → Preferences → Receive Satellite email/app notifications within the Agremo application.
Understanding Vegetation Indices
Vegetation indices are crucial tools in precision agriculture, providing insights into plant health, growth stages, and environmental conditions.
Here’s a guide to some commonly used indices that you will have with Agremo:
1. MSAVI (Modified Soil-Adjusted Vegetation Index)
- Purpose: Assess plant development and uneven growth.
- Accuracy: Provides accurate data even in low vegetation or plants lacking chlorophyll.
- Values:
- 0.2 to 0.4: Seed germination stage.
- 0.4 to 0.6: Leaf development stage.
- 0.6: Apply NDVI instead.
- Usage: Ideal for the early season
2. NDVI (Normalized Difference Vegetation Index)
- Purpose: Measure vegetation density or biomass
- Values:
- Negative: Clouds, water, rocks, bare soil
- Values lower than 0.10 represent sparse vegetation
- Values higher than 0.10 represent dense
- Usage: Suitable for the growing stage
3. RECI (Red Edge Chlorophyll Index)
- Purpose: Estimate chlorophyll content in leaves
- Values: Responsive to chlorophyll content and nitrogen nourishment
- Usage: Most useful during active vegetation development but not suitable for harvesting season</span></span></span>
4. EVI (Enhanced Vegetation Index)
- Purpose: Evaluate plant health, vegetation density, and biomass
- Benefits: Enhances sensitivity to high biomass areas and minimizes atmospheric interference
- Values: 0.20 to 0.80 indicate healthy vegetation
- Usage: Growing stage
5. NDRE (Normalized Difference Red Edge Index)
- Purpose: Assess plant health, particularly in permanent or later
- Values:
- 0.2 to 0.6: Unhealthy or immature crops
- 0.6 to 1: Healthy, mature, ripening crops
- Usage: Maturity and pre-harvest stages
6. NDMI (Normalized Difference Moisture Index)
- Purpose: Detect moisture levels in vegetation
- Values: Range from -0.2 to 1, indicating varying levels of canopy cover and water stress
- Usage: Throughout the growing season
7. NDWI (Normalized Difference Water Index)
- Purpose: Measure surface water presence
- Values:
- 0.2 to 1: Water surface
- 0.0 to 0.2: Flooding, humidity
- -0.3 to 0.0: Moderate drought, non-aqueous surfaces
- -1 to -0.3: Drought, non-aqueous surfaces
- Usage: Throughout the growing season
Each index offers unique insights into different aspects of vegetation health and growth, empowering farmers to make informed decisions for optimal crop management.
