
Agremo helps precision growers automatize different field processes and in that way simplify plant monitoring and cut the time and costs of planning annual field activities. Our Crop Monitoring software enables quick and accurate plant counting, plant stress monitoring, weed detection, analysis of canopy cover and plant vegetation, variable rate maps, and more. Request a demo if you are looking at better utilization of your equipment, a greater understanding of what causes certain field manifestations, improved sub-optimal crop production and increased profit.

Free demo - no credit card required


Yes, of course. You can import field boundaries and annotations by importing SHP or KML file, or connecting to MyJohnDeere Operations Center, and importing the boundaries from there. You can use the SHP-KML import option for any kind of boundaries – growers field, trial, or breeding plot.
Results of Agremo analyses are provided in shapefile that is used for creating variable prescription maps in third party software. Check how to create a variable prescription map in AG leader SMS.
Yes, we can. Agremo can differentiate damage done by wild animals from other stresses and focus on quantifying only those areas.
Agremo can’t name the disease and pest that is affecting your crops. It tells you where infested plants are located but it can’t tell which pest or disease is there or suggest chemicals for treatment.
It depends on the analysis that you need. First analyses on plants can be done when they are at least 4in tall while weed analysis or waterlogging analysis can be done before planting.
If you don’t have internal resources for drone mapping, we can do that for you by utilizing our drone resources or finding a fit 3rd party drone service provider in our DSP partner network. In addition to that, if you are interested in building up your drone team, we can guide you through that process as well.

Agremo's AI solution turns DJI's drone imagery into actionable insights, and its recipe maps make our AGRAS drone a truly intelligent and precise spraying tool." The integration of the Agremo platform between Agremo and the DJI drone is a turnkey solution for precision agriculture.
The biggest benefit for farmers who use drones and Agremo reports is that they increase their yields, reduce costs or improve their productivity. In the end, all these benefits are lead to extra profits.
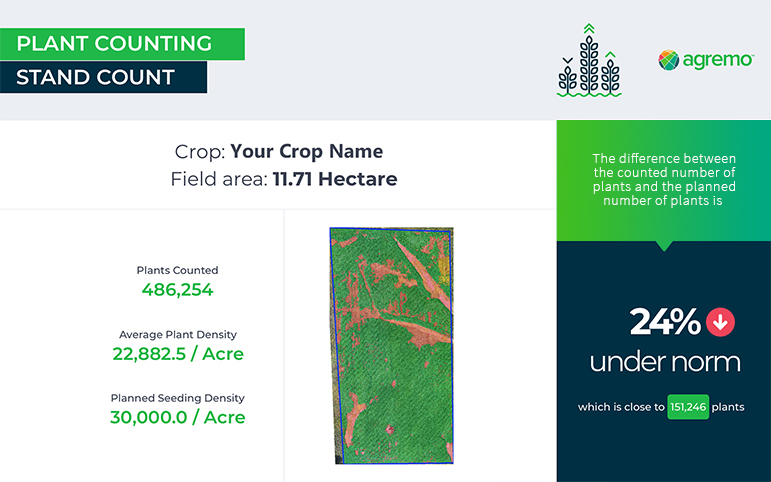
Agremo Stand Count analysis shows how successful seeding was and how many plants farmers will be able to harvest. Withal, it can help to apply different sowing standards in different parts of the plot, in order to achieve the highest yields.