What is NDVI and How can it be Interpreted?
NDVI (Normalized Difference Vegetation Index) is an indicator of plant health based on the analysis of light reflection in the red and near-infrared spectrum. It is widely used in precision agriculture, ecology, and remote sensing to monitor vegetation and make data-driven decisions. NDVI in precision agriculture plays a key role in improving crop management by providing timely insights into plant health and development.
How NDVI Works
NDVI is calculated using the following formula:
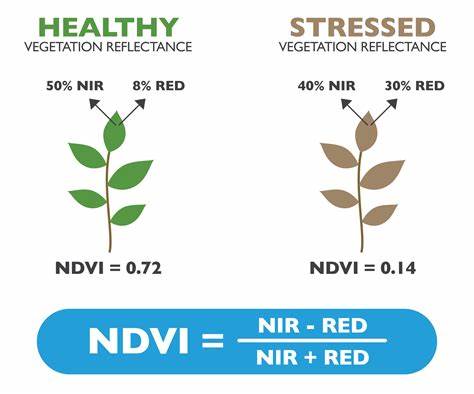
NDVI (Normalized Difference Vegetation Index)
This formula leverages the fact that healthy vegetation strongly absorbs visible red light (for photosynthesis) and reflects near-infrared (NIR) light due to its cellular structure.
NDVI values range from -1 to +1:
- Values close to +1 indicate dense, healthy vegetation.
- Values around 0 indicate sparse or stressed vegetation.
- Values near -1 typically represent non-vegetative features like water or bare soil.
Uses of NDVI Data
NDVI data serves multiple purposes in precision agriculture. It allows for continuous crop growth monitoring by offering detailed insights into plant development and vitality across the growing season. Farmers and agronomists can detect crop issues early. NDVI also supports localized treatment application, helping to identify specific zones within a field that require targeted fertilization, irrigation, or crop protection. Furthermore, it plays a role in tracking crop maturity, assessing whether crops are nearing harvest readiness based on their physiological state. Lastly, Farmers often correlate NDVI values with yield prediction models to estimate expected harvest volumes.
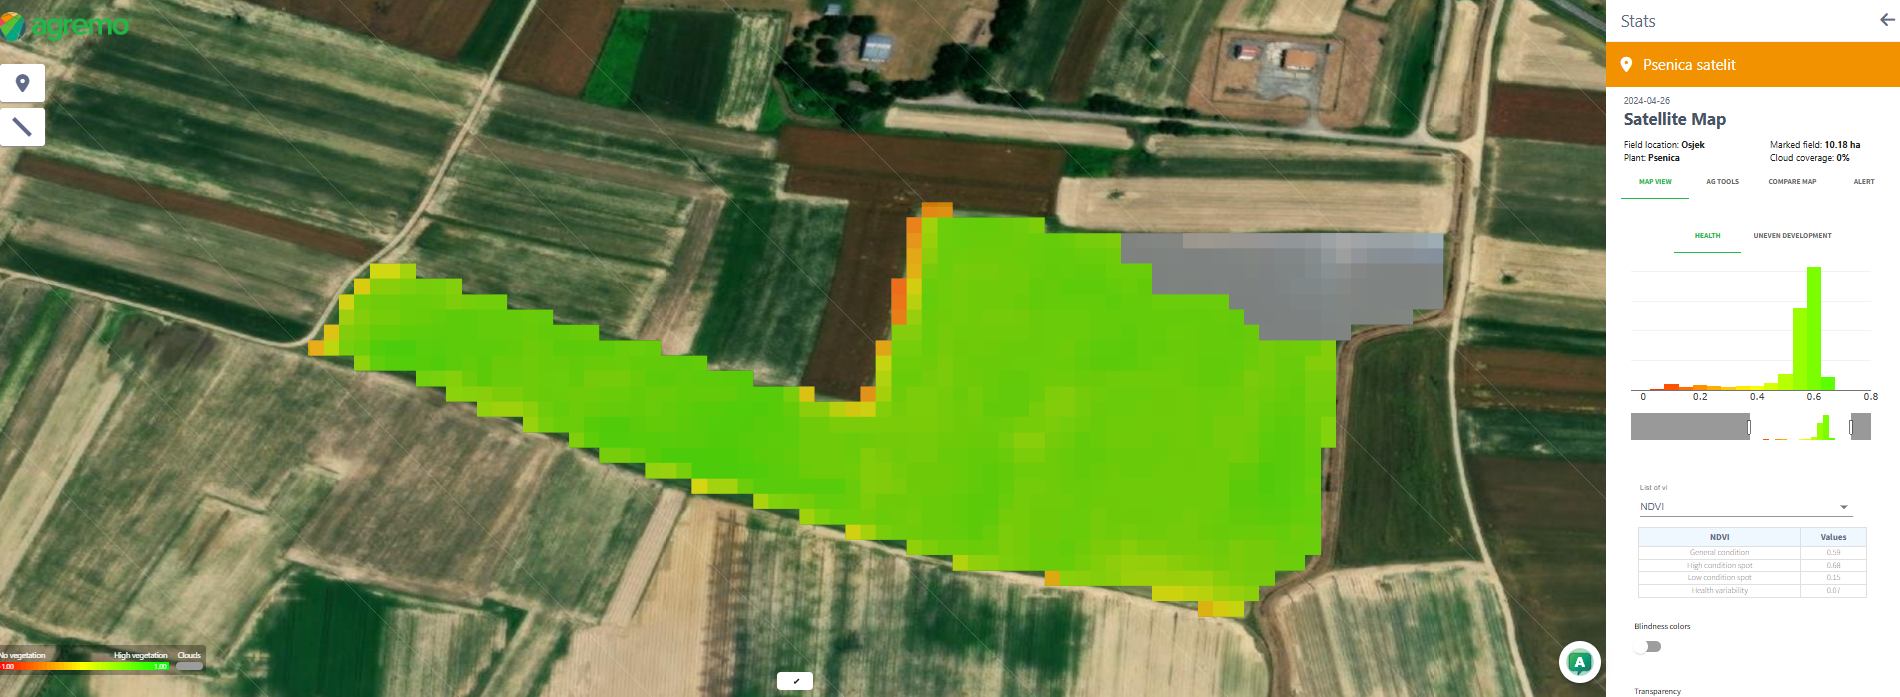
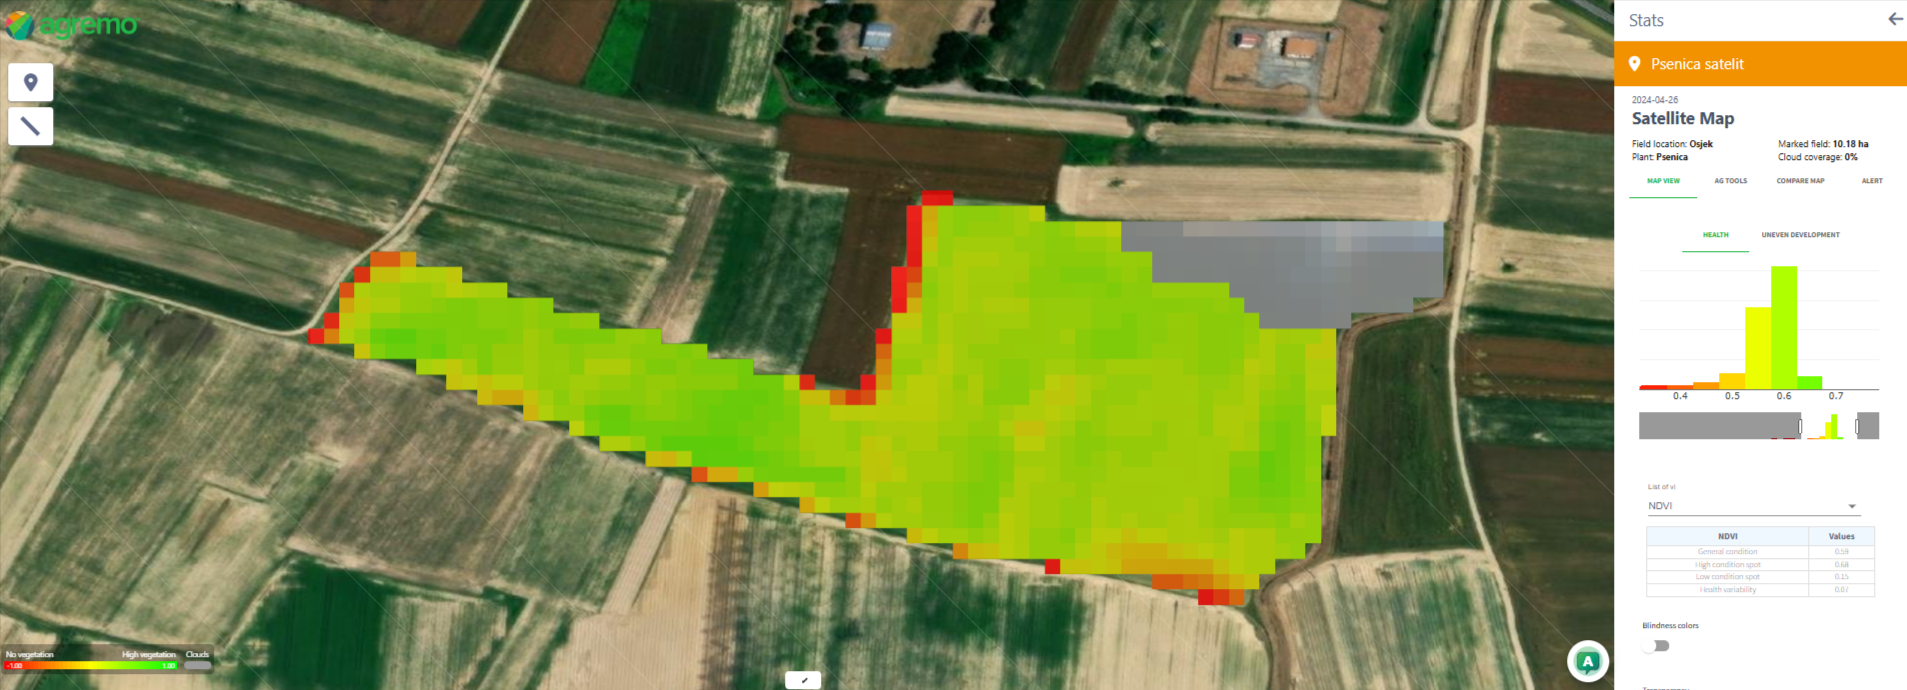
How is NDVI Displayed and Used?
NDVI is typically represented as color-coded maps indicating different vegetation levels:
- Green Shades -Healthy vegetation
- Yellow Shades- Moderate growth, potential stress areas
- Red Shades- Problematic areas, dry soil, or diseased plants
Scale and Color Interpretation
| NDVI Value | Color | Description |
|---|---|---|
| 0.6 – 1.0 | ✅ Dark Green | Healthy vegetation with high photosynthesis levels |
| 0.2 – 0.6 | 🟨 Yellow-Green | Early growth or stress conditions (water/nutrient deficiencies, disease) |
| 0.0 – 0.2 | 🟧 Orange | Damaged vegetation, poor growth, post-harvest stage |
| -1.0 – 0.0 | 🟥 Red | No vegetation, bare soil, or dead plants |
Early growth or stress conditions (water/nutrient deficiencies, disease)
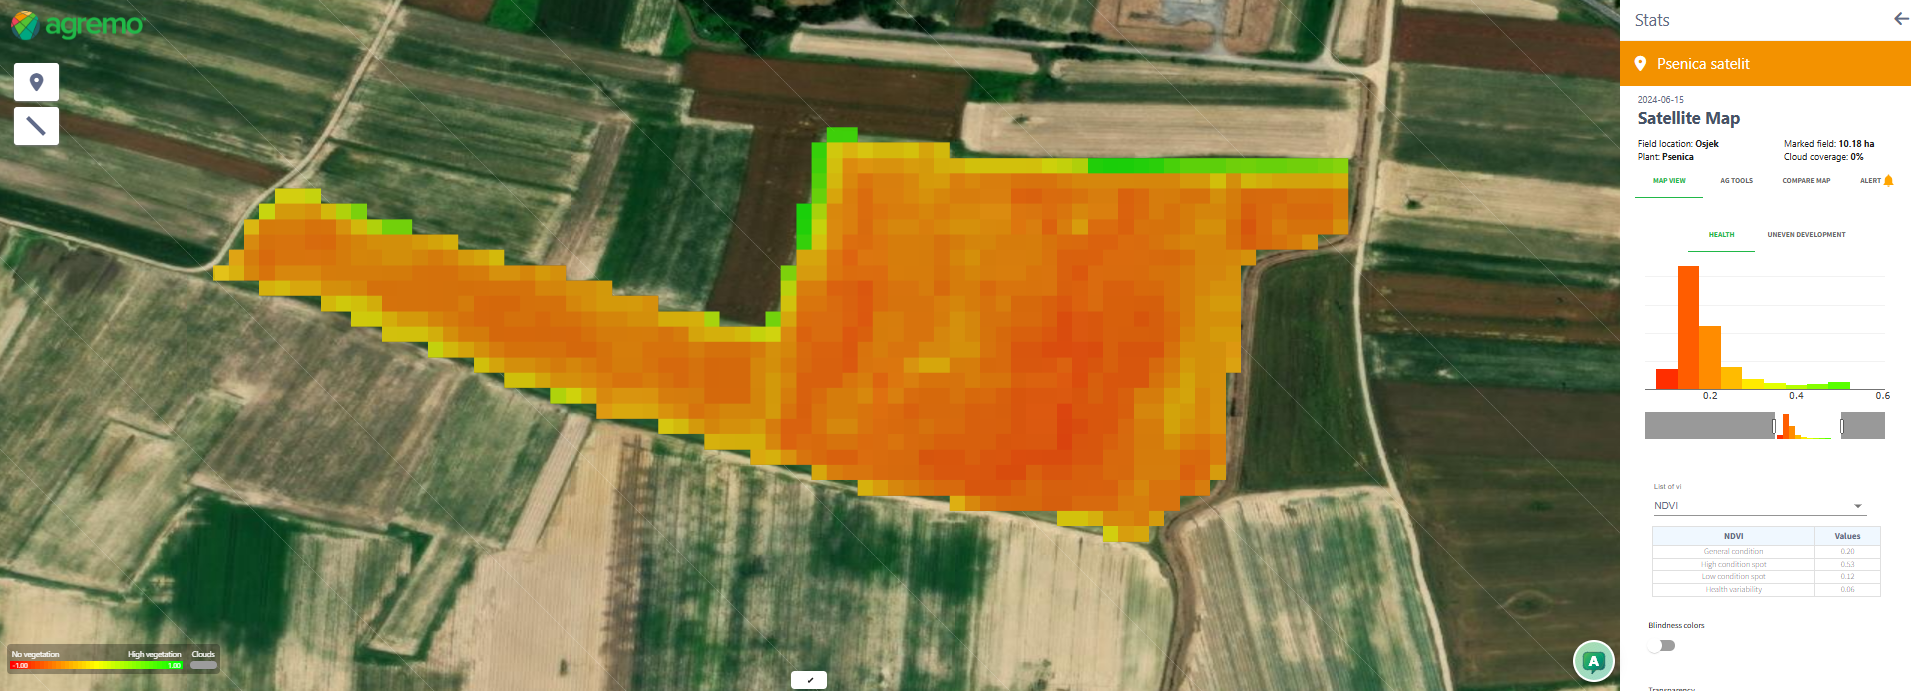
NDVI Across Vegetation Growth Stages
Throughout the crop lifecycle, NDVI values reflect different vegetation stages and provide insights into plant development. In the early stages, values between 0.2 and 0.4 indicate crop emergence. As growth intensifies, NDVI rises to 0.5–0.8, showing strong photosynthesis and healthy biomass. When plants begin flowering and maturing, NDVI declines slightly to 0.4–0.7, marking the shift of energy to reproductive structures. During the drying phase, NDVI drops to 0.2–0.5 due to reduced chlorophyll and leaf senescence. Stress conditions, such as water shortage or nutrient deficiency, can push NDVI down to 0.1–0.4. After harvest, NDVI typically falls to between -0.1 and 0.2, indicating bare soil or minimal residue.
Integrating NDVI in Precision Agriculture
Modern farms often integrate NDVI data through aerial platforms such as drones and satellites. These tools allow:
- Rapid field assessments
- Targeted ground scouting
- In-season adjustments to input use (fertilizer, irrigation)
- Data-driven decision making for sustainable production
Depending on the specific crop and growth stage, indices such as EVI (Enhanced Vegetation Index) or SAVI (Soil Adjusted Vegetation Index) might offer additional insights.
Growers and researchers rely on NDVI as a crucial tool in precision agriculture, gaining valuable insights into plant health, development, and stress conditions. into plant health, growth, and stress conditions. By interpreting NDVI data correctly, farmers and researchers can make informed decisions to optimize crop production.
Vegetation indices in Agremo
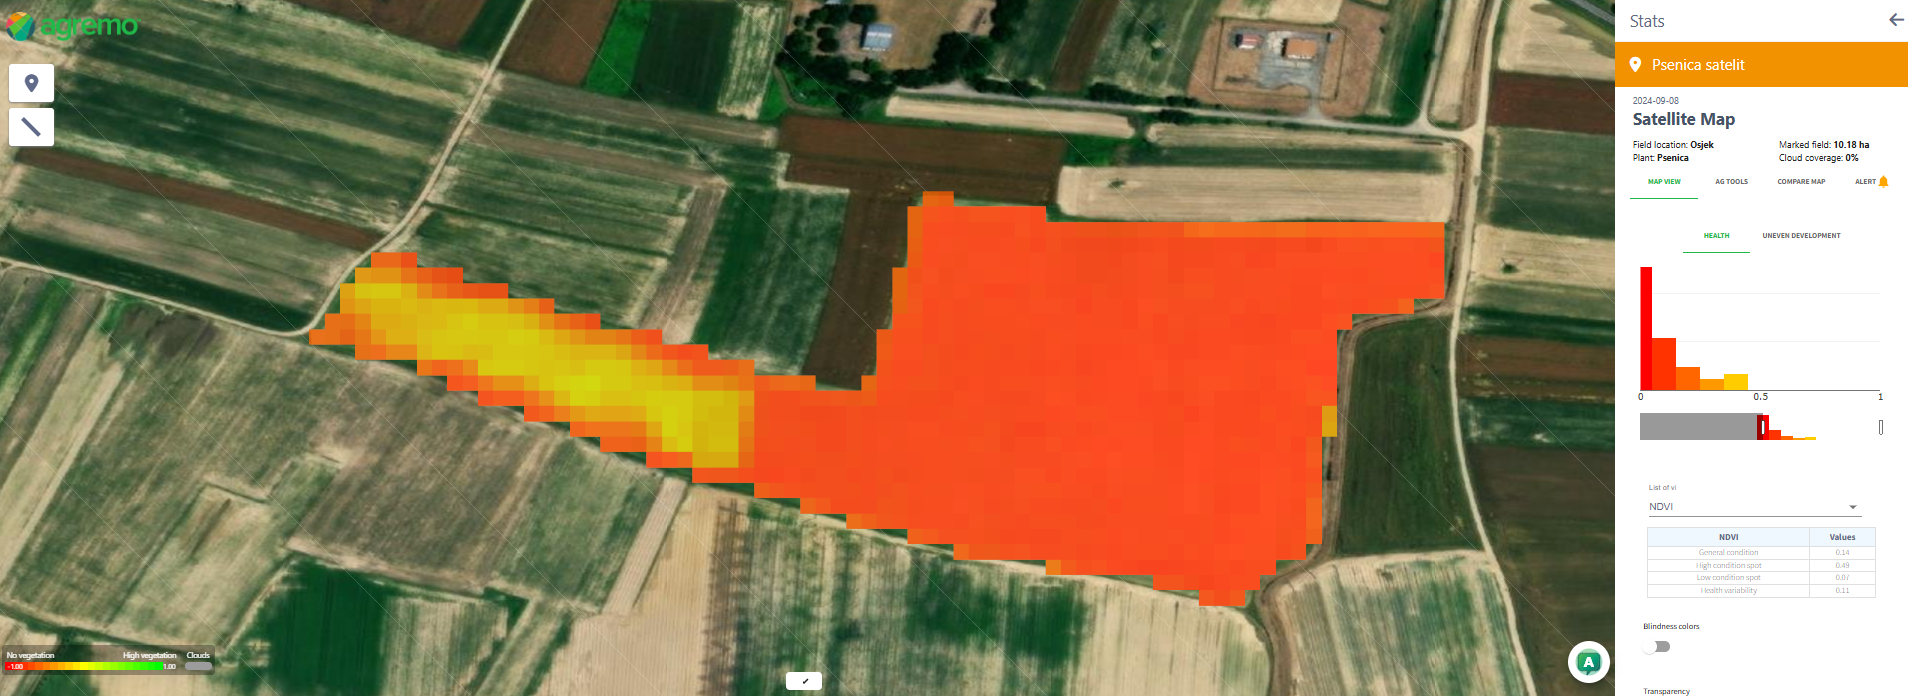
Agremo provides advanced crop analysis powered by vegetation indices, enabling farmers and agronomists to monitor plant health with high precision:
- Satellite imagery – Get instant access to vegetation index maps (NDVI, NDRE, NDWI, RECI, EVI, MSAVI and NDMI) immediately after field creation, providing quick insights into crop variability and overall field conditions.
- Drone imagery (Real-time Plant Health analysis) – Upload your drone maps and receive vegetation index-based plant health analysis instantly, enabling fast and accurate decision-making in the field.
- RGB maps – VARI, ExG, GLI, Visual NDVI
- Multispectral maps – NDVI, NDWI, SAVI, OSAVI, NDRE, GDVI