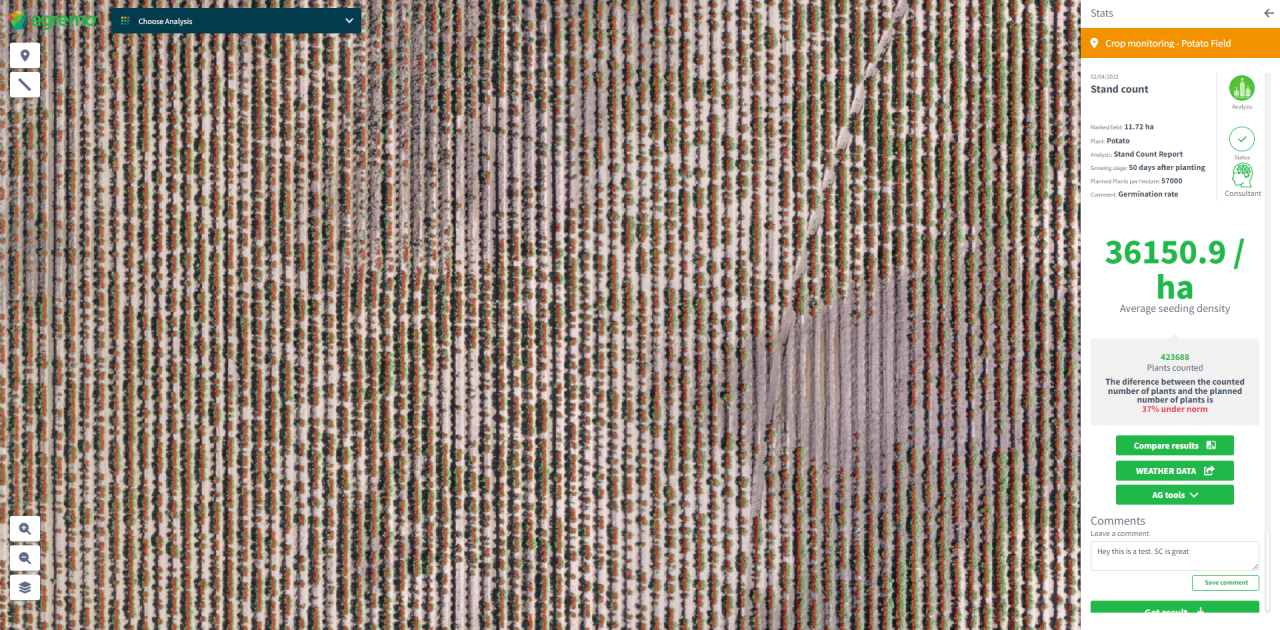
Stand Count determines the precise number of plants in a specific area, compares it to the expected results, and calculates percentages under the norm in a conventional field or field trials. Use it to get the accurate number of plants per micro-plot or a single row, evaluate seed quality (germination rate), decide whether to replant or not and mark the zones of potential yield losses. By obtaining an early yield estimate from Stand Count analysis, it’s easier to plan future agricultural operations and be proactive in replanting efforts.
Save up to $50 per acre
Save up to $50 per acre when replanting corn or soybean
Corn/soybean replant worksheet example*
| A. Estimated stand density of sparse stand | 14,000 plants/acre |
| B. “Expected” yield in bushels/acre | 165 bu/acre |
| C. Effect of sparse stand on yield potential (from Table 3 or 4) | 73 percent |
| D. Estimated yield from sparse stand (line B × line C ÷ 100) | 120.45 bu/acre |
| E. Estimated market value of crop | $5.50 /bushel |
| F. Estimated income from sparse stand (line E × line D) | $662.48 /acre |
| G. Extra herbicide needed due to sparse stand | $10.00 /acre |
| H. Expected net income from sparse stand (line F – line G) | $652.48 /acre |
| I. Estimated cost to replant (total of lines 1 + 2 + 3 + 4 below) 1. Seed __________ 2. Fuel, machinery, labor________ 3. Pesticides __________ 4. Additional costs __________ | $50.00 /acre |
| J. Effect of planting date on yield (from Table 5 or 6) | 83 percent |
| K. Estimated yield from replanted stand (line B × line J ÷ 100) | 136.95 bu/acre |
| L. Estimated income from replanted stand (line E × line K) | $753.23 /acre |
| M. Net income from replanted stand(line L – line I) | $703.23 /acre |
| N. Profit or loss from replanting (line M – line H) | $50.75 /acre |
*Assumptions
Stand Count can be used throughout the year, in almost all growing stages of crops after they are 12 cm or 4 inches tall. This analysis gives the relevant information for both early and late season and in that way gives you a chance to compare the number of plants at the beginning and end of the season.
Stand Count and Micro-Plot Stand Count analyses are ideal for field crops and can be used to give you precise stand count information about wheat, barley, corn, soybean, potato, rapeseed, sunflower, and sugar beet. Additionally, Stand Count analysis for conventional fields gives great results on tobacco, sugar cane, rice, and cotton fields.
No credit card required
The Stand Count report is designed for seasonal crops (corn, soy, wheat) while Plant Population is more suitable for perennial plants (tree fruits, pines, etc.).
Plants should be at least 4in tall for first Stand Count analysis, and there is no maximum height.
Stand Count report is providing information about the difference between the planted and emerged number of plants (% under the norm). Recommended set is the expected number of the plants per acre (info about seeding rate) based on which we calculate the % under the norm.
Stand Count analysis was successfully applied on over 100 different crops. The majority of users stick with RGB images, so if you have one, there is no need for any other sensor. In addition to the RGB, we also support multispectral and NIR.
Yes, we can. Agremo developed three different algorithms for plant counting. One of them is specially designed for counting plants that are overlapping or seeded in high density such as wheat or barley.
The Stand Count report is designed for seasonal field crops such as corn, wheat, soybeans, potato, canola, sugarbeet, barley.
Agremo can’t count fruits itself because much fruit hides inside the canopy; thus, you can’t detect all of them on a 2D drone image.

Agremo's AI solution turns DJI's drone imagery into actionable insights, and its recipe maps make our AGRAS drone a truly intelligent and precise spraying tool." The integration of the Agremo platform between Agremo and the DJI drone is a turnkey solution for precision agriculture.
The biggest benefit for farmers who use drones and Agremo reports is that they increase their yields, reduce costs or improve their productivity. In the end, all these benefits are lead to extra profits.
Agremo Stand Count analysis shows how successful seeding was and how many plants farmers will be able to harvest. Withal, it can help to apply different sowing standards in different parts of the plot, in order to achieve the highest yields.