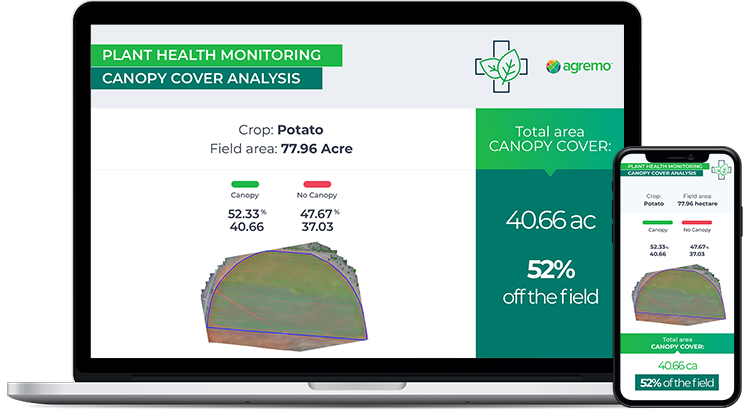
Canopy Cover provides information about the exact percentage covered by canopy/leaf area and ground cover area. The report you receive includes vital data on vegetation conditions and primary plant productivity, as well as all the necessary details regarding the leaf area index (LAI). As LAI is one of the key parameters used in plant ecology to indicate a plant’s health, this means that you get much-needed help with driving better overall crop performance. Rely on Agremo Canopy analysis to determine the most optimal LAI for the fruits, vegetables or cereals you grow on the field.
Get up to 30%
Get up to 30% more accurate and quantifiable results, compared to the traditional methods.
The optimum time to use Agremo Canopy analysis is during the growth and harvesting stages of the crop cycle. This allows you to monitor the overall health of your plants, assess possible plant damage, and take appropriate steps to prevent it.
With its actionable insights and advanced analytics, Canopy Cover analysis is an ideal solution for every farmer looking to successfully cultivate field crops, forestry, plantation, and vegetables.
No credit card required
The difference is only in expression, Agremo Canopy Cover analysis provides separate data for leaf area, and ground area, and LAI is calculated: LAI = leaf area/ground area, m2 / m2
No, it does not. It only includes surface and % of leaf area vs. ground area.
We can calculate canopy coverage of all plants, but it can’t get info per plant type. It must be done in two separate requests if it is necessary to have distinct canopy info for each plant type.

Agremo's AI solution turns DJI's drone imagery into actionable insights, and its recipe maps make our AGRAS drone a truly intelligent and precise spraying tool." The integration of the Agremo platform between Agremo and the DJI drone is a turnkey solution for precision agriculture.
The biggest benefit for farmers who use drones and Agremo reports is that they increase their yields, reduce costs or improve their productivity. In the end, all these benefits are lead to extra profits.
Agremo Stand Count analysis shows how successful seeding was and how many plants farmers will be able to harvest. Withal, it can help to apply different sowing standards in different parts of the plot, in order to achieve the highest yields.