Overview
The Real-time Plant Health analysis provides instant insights into your field’s condition using vegetation indices. Analyze crop stress, monitor growth variability, and generate actionable data for Spot and Variable Rate prescription maps.
With Real-time Plant Health, you can:
- Visualize Plant Health on your field map
- Switch between vegetation indices to see different insights
- Generate prescription maps ready for spraying
- Share detailed PDF reports with all field insights
How to Access
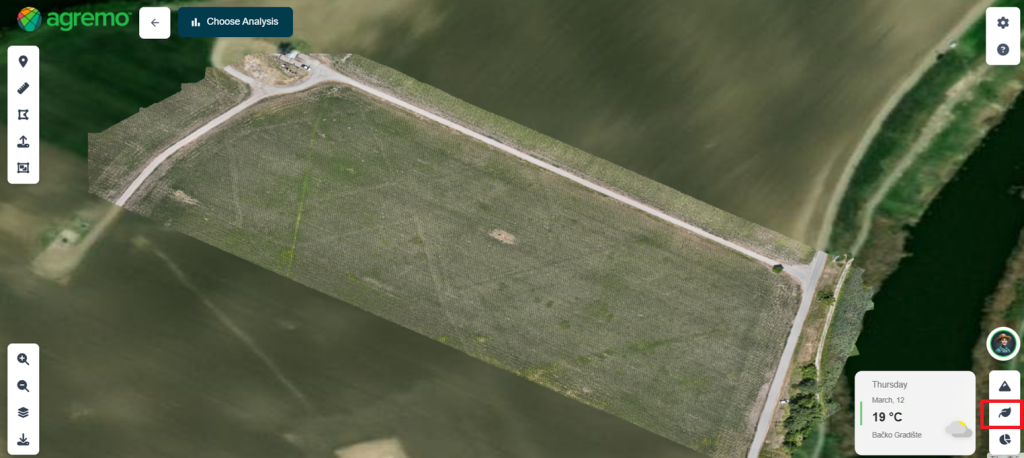
- Open the uploaded GeoTIFF map
- Access Real-time Plant Health by clicking the button in the bottom-right corner
How It Works
When you open Real-time Plant Health, you’ll see two main tabs:
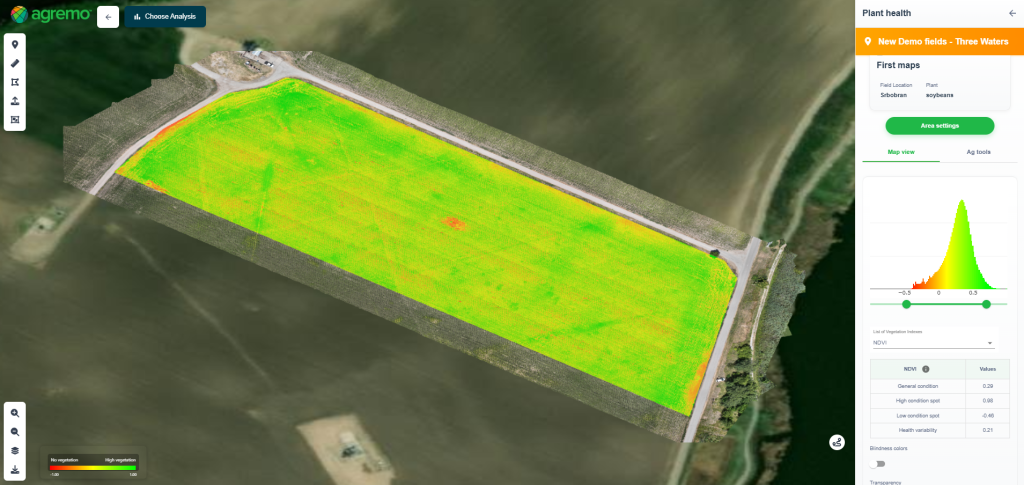
- Map View (default): Visualize analyses directly on your field map using various vegetation indices, highlighting crop stress, variability, and Plant Health.
- AG Tools: Use the Zone Management tool to define zones and create Prescription Maps with the Fertilizer and Spraying tools, ready for precision applications.
Map view
The Map View tab displays Plant Health directly on your field map based on the selected vegetation index. The available indices depend on the type of map uploaded:
RGB maps: VARI, ExG, GLI, Visual NDVI
Multispectral maps: NDVI, NDWI, SAVI, OSAVI, NDRE, GDVI
💡 Note: If both RGB and Multispectral datasets are uploaded, all indices are available for selection.
Key features:
- Area settings: Adjust the field boundary to define the exact area for which vegetation indices will be displayed and analyzed.
- Ag tools: Create management zones and generate prescription maps for variable-rate spraying and fertilization.
- Operation planning: Operation planning lets you define field boundaries, mark obstacles, and create no-spray zones to ensure accurate, efficient field operations.
- Interactive slider: Adjust the slider to refine your analysis for more precise results.
- Field statistics: View detailed stats for each selected index to better understand crop variability and Plant Health.
- Blindness Colors button: Toggle color schemes designed for color vision accessibility to ensure clear visualization for all users
- Export PDF reports: Once your analysis is set, download a PDF report including the latest changes and insights, ready to share with clients or team members
Area settings
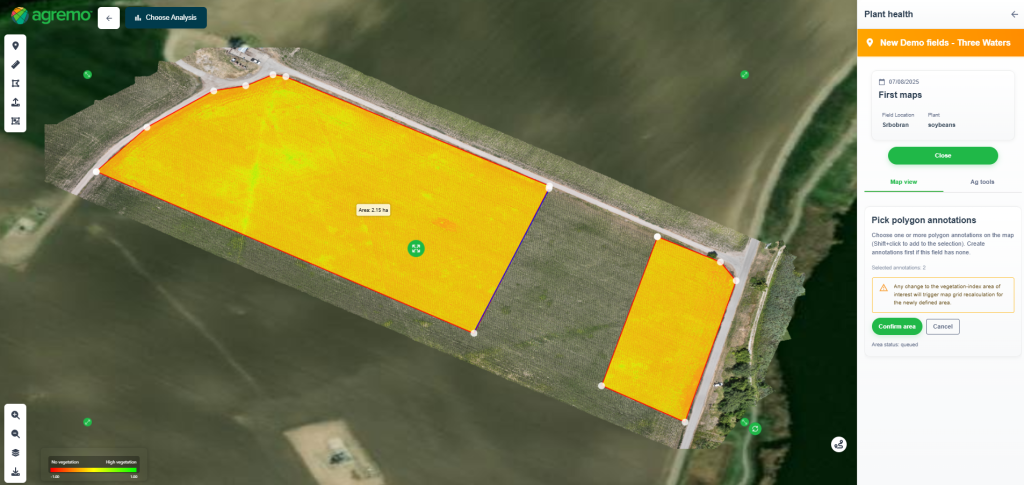
Area settings allow you to edit the existing field boundary or create a completely new one, based on which vegetation index results will be displayed.
How it works:
- Click the Area settings button
- Edit the existing boundary or draw one or more annotations
- Select the annotations where you want the results to be shown
- Click the Confirm area button
- Results will be displayed only within the selected areas. The histogram will show aggregated results across all selected annotations.
Ag tools
The AG Tools tab gives you full control over creating and customizing prescription maps for your field. It includes three main tools:
- Zone Management Tool – Define and manage zones for precise field analysis.
- Fertilizer Tool – Generate prescription maps for variable rate fertilization.
- Spraying Tool – Create Spot or Variable Rate spraying maps ready for application.
How it works:
- By default, the system generates separate maps based on your field boundaries and the uploaded map type. Field boundaries are created when defining your field. All maps use the same vegetation indices, with different tile sizes.
- You can select one of the pre-generated maps or click Create New Map to design a custom zoned map.
- Customization options include:
- Field boundary selection
- Vegetation index choice
- Number of zones
- Tile size for precise control
This workflow allows you to quickly generate actionable prescription maps. It provides full flexibility to adjust them based on your field’s unique characteristics.
Operation Planning overlays defined obstacles and no-spraying zones onto the prescription map. The system excludes these areas from treatment calculations and savings estimation, ensuring more accurate results.
You can find more details on how to create an Operation Planning setup here.
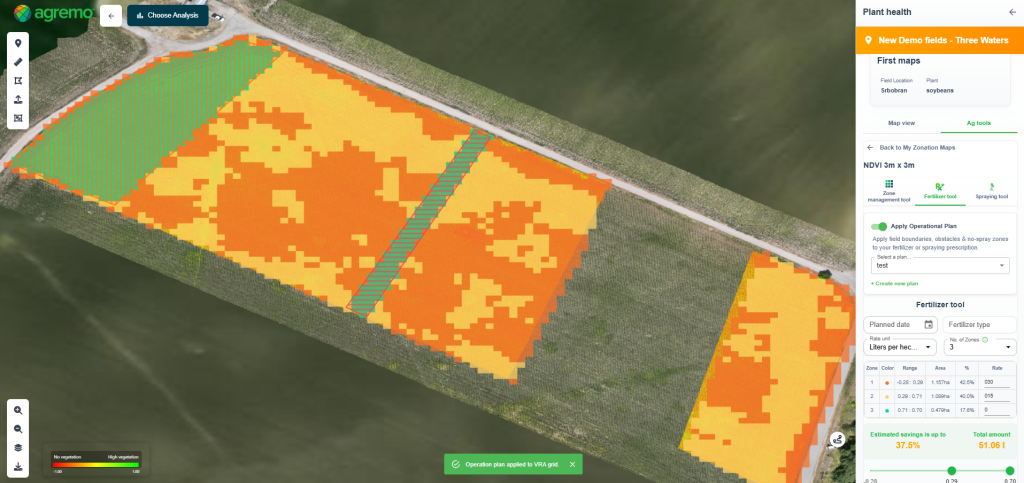
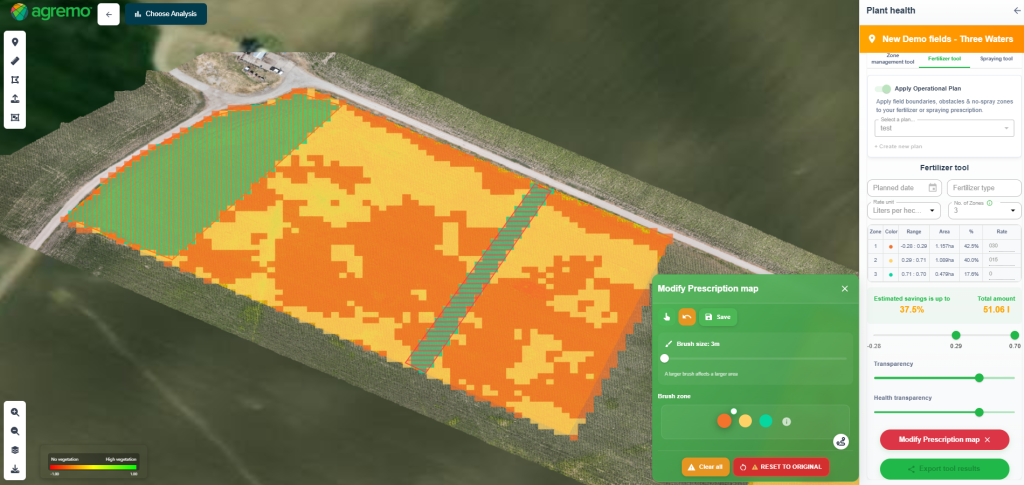
For even greater control, users can further fine-tune or redesign their prescription maps by clicking the Modify Prescription Map button. This powerful tool allows you to:
- Adjust field areas to reflect on-the-ground realities
- Edit zones and application rates for maximum efficiency
- Optimize inputs to reduce chemical usage and save costs
- Refine maps for Spot or Variable Rate applications, ensuring precision and flexibility
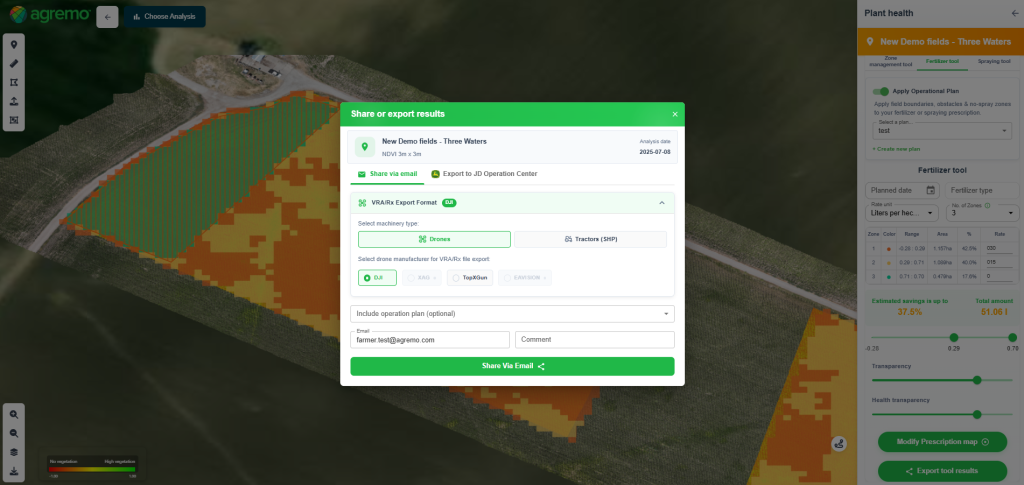
All changes apply instantly. By clicking Export Tool Result, you can download your updated maps in just two clicks, ready to be imported directly into JDOC, XAG, DJI, TopXgun, and EAvision. This ensures every prescription map is accurate, actionable, and fully optimized for precision spraying and fertilization.
💡 Tips: Quickly gain essential insights about your fields using Vegetation Indices with Real-time Plant Health. For more advanced use cases and deeper crop intelligence, explore our AI-powered analyses to unlock precise data on: Stand Count, Invasive Species Detection, Lodging & Green Snap, and more. Combine fast Plant Health previews with advanced AI analyses to make smarter, faster, and more actionable field decisions.