Creating VRA for XAG Spraying Drone
Step 1 – Create a field boundary
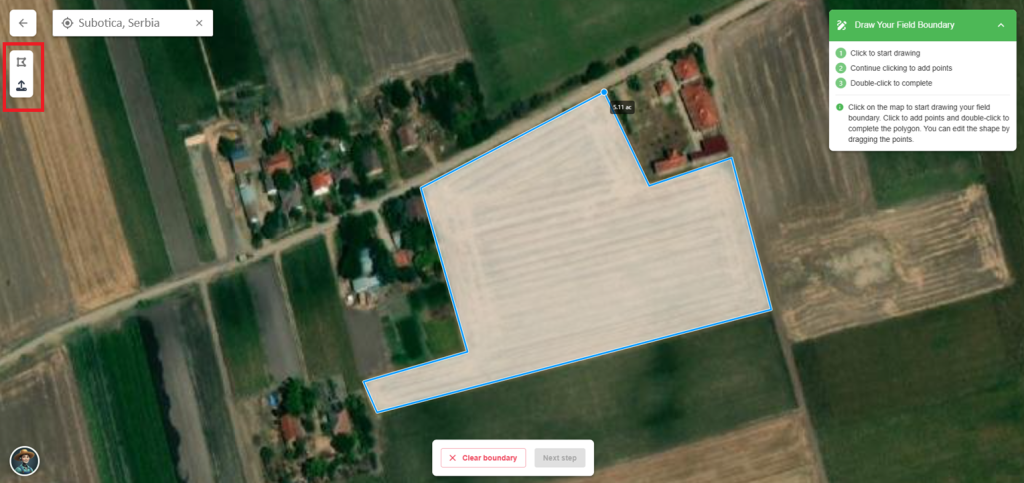
To start, create a field boundary (draw manually or import a SHP file) by outlining the borders of the field you wish to analyze.
It doesn’t have to be perfect, but the more accurately you draw it, the better results you’ll get later. Since Real-time analysis based on vegetation indices (VIs) is generated using this boundary, accurately drawing it helps ensure that your VRA maps reflect the actual field conditions.
Also, once the boundary is in place, requesting AI analyses is just one click away — no need to redraw or reselect the area again.
Step 2 – Upload a map (orthophoto or raw data)
Upload either an orthophoto map or raw image data of your field. We support both RGB and Multispectral images.
Step 3 – Create VRA map for XAG Spraying Drone based on VIs
Navigate to Real-time analyses and open the Ag Tools tab.
Here, you can:
- Select from pre-generated grid templates, or
- Create your grid by adjusting the parameters to fit your needs
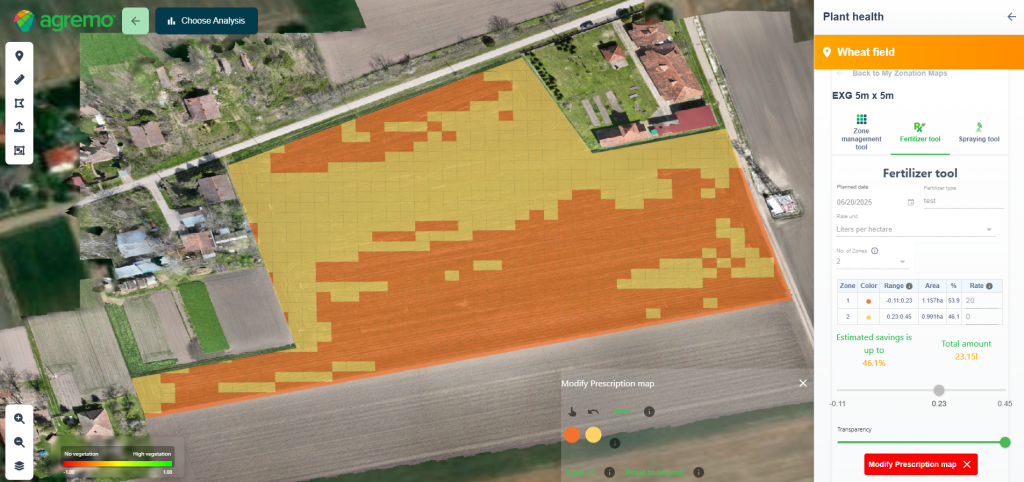
- Choose one of the available tools: Fertilizer or Spraying, depending on your specific needs
ℹ️ Note: If you’re planning to use XAG drones, make sure to set the tile size to 5×5 meters and up to 3 zones, as this is required for compatibility with their spraying system.
Once configured, your VRA map is automatically generated.
If you want to further fine-tune your map, no worries.
You can make additional edits anytime using the Modify Prescription Map tool, where you can merge or split zones to better match your agronomic strategy.
Step 4 – Request Weed detection or Plant Vigor analysis
To gain deeper insights, request AI-powered analyses such as:
- Weed Detection – to identify weed-infested zones and plan targeted treatments. This analysis is particularly useful in green-on-green scenarios, where distinguishing between weeds and crops is challenging using traditional methods or vegetation indices alone.
- Plant Vigor Analysis – to assess crop health and identify variability across the field. While VIs already provide a basic overview of plant condition, this analysis offers a more detailed and precise view, helping you better understand in-field differences and make smarter agronomic decisions.
Step 5 – Create VRA map for XAG Spraying Drone based on AI Advanced analyses
Once the analysis results are ready, you can use them to create a new VRA map.
Navigate to the Ag Tools tab and generate a VRA map using zones derived directly from the AI analysis output.
This enables highly precise and data-driven input applications.
ℹ️ Note: If you’re planning to use XAG drones, make sure to set the tile size to 5×5 meters and up to 3 zones, as this is required for compatibility with their spraying system.
Step 6 – Export data
After reviewing your VRA map, you can export the data by sending it directly to your preferred email address.
The export package will include:
- SHP and RX files
- XAG folder containing the required KML and JSON files for the spraying mission
- A PDF report summarizing the map
- A PNG image of the field and zone layout
Note: If you’re exporting a map based on an AI analysis, make sure to open the RX file to locate the XAG folder with the necessary files.
Important: XAG drones support spraying missions of up to 33 hectares.
If your field is larger than that, Agremo will automatically split the mission into multiple blocks, ensuring full compatibility with the XAG system.
This way, your VRA for XAG spraying drone is ready for field use, no additional formatting or conversion needed.
Watch how one farmer uses Agremo’s VRA map with a spraying drone to achieve precise pesticide application and reduce input costs. A real-world example of smart farming in action.
